Q. How will you go about creating a memory leak in Java?
A. In Java, memory leaks are possible under a number of scenarios. Here is a typical example where hashCode( ) and equals( ) methods are not implemented for the Key class that is used to store key/value pairs in a HashMap. This will end up creating a large number of duplicate objects. All memory leaks in Java end up with java.lang.OutOfMemoryError, and it is a matter of time. The following code agressively creates the OutOfMemoryError via an endless loop for demonstration purpose.
If you are not familiar with the significance of equals( ) and hashCode ( ) methods in Java learn how to define proper key class in Java.
import java.util.HashMap;
import java.util.Map;

public class MemoryLeak {

 public static void main(String[] args) {
  Map<Key, String> map = new HashMap<Key, String>(1000);

  int counter = 0;
  while (true) {
       // creates duplicate objects due to bad Key class
   map.put(new Key("dummyKey"), "value");
   counter++;
   if (counter % 1000 == 0) {
    System.out.println("map size: " + map.size());
    System.out.println("Free memory after count " + counter
      + " is " + getFreeMemory() + "MB");

    sleep(1000);
   }


  }
 }

 // inner class key without hashcode() or equals() -- bad implementation
 static class Key {
  private String key;

  public Key(String key) {
   this.key = key;
  }

 }

 //delay for a given period in milli seconds
 public static void sleep(long sleepFor) {
  try {
   Thread.sleep(sleepFor);
  } catch (InterruptedException e) {
   e.printStackTrace();
  }
 }

 //get available memory in MB
 public static long getFreeMemory() {
  return Runtime.getRuntime().freeMemory() / (1024 * 1024);
 }

}
If you run the above code, you will get the ouput as shown below
map size: 1000
Free memory after count 1000 is 4MB
map size: 2000
Free memory after count 2000 is 4MB
map size: 1396000
Free memory after count 1396000 is 2MB
map size: 1397000
Free memory after count 1397000 is 2MB
map size: 1398000
Free memory after count 1398000 is 2MB
map size: 1399000
Free memory after count 1399000 is 1MB
map size: 1400000
Free memory after count 1400000 is 1MB
map size: 1401000
Free memory after count 1401000 is 1MB
.....
.....
map size: 1452000
Free memory after count 1452000 is 0MB
map size: 1453000
Free memory after count 1453000 is 0MB
Exception in thread "main" java.lang.OutOfMemoryError: Java heap space
 at java.util.HashMap.addEntry(HashMap.java:753)
 at java.util.HashMap.put(HashMap.java:385)
 at MemoryLeak.main(MemoryLeak.java:10)
As you could see, the size of the map keeps growing with the same objects and the available memory keeps coming down from 4MB to 0MB. At the end, the program dies with an OutOfMemoryError.
Q. How will you fix the above memory leak?
A. By providing proper implentation for the key class as shown below with the equals() and hashCode() methods.
.....If you rerun it after making the fix shown above to the MemoryLeak class, you will get an output as shown below. The program runs endlessly, and creates only one object in the HashMap.
static class Key {
private String key;
public Key(String key) {
this.key = key;
}
@Override
public boolean equals(Object obj) {
if (obj instanceof Key)
return key.equals(((Key) obj).key);
else
return false;
}
@Override
public int hashCode() {
return key.hashCode();
}
}
.....
map size: 1
Free memory after count 1000 is 4MB
map size: 1
Free memory after count 2000 is 4MB
map size: 1
Free memory after count 3000 is 4MB
map size: 1
Free memory after count 4000 is 4MB
...
Free memory after count 73000 is 4MB
map size: 1
Free memory after count 74000 is 4MB
map size: 1
Free memory after count 75000 is 4MB
Q. In real applications, how do you know that you have a memory leak?
A. If you profile your application, you can notice a graph like a saw tooth. Here is how you can determine this with the help of jconsole for the above bad key class example. All you have to to do is while your MemoryLeak is running, get the Java process id by typing
C:\>jps
5808 Jps
4568 MemoryLeak
3860 Main
Now, open up the jconsole as shown below on a command line
C:\>jconsole 4568
If try this for both good key class and the bad key class you will get the memory graphs as shown below.
No memory Leak:
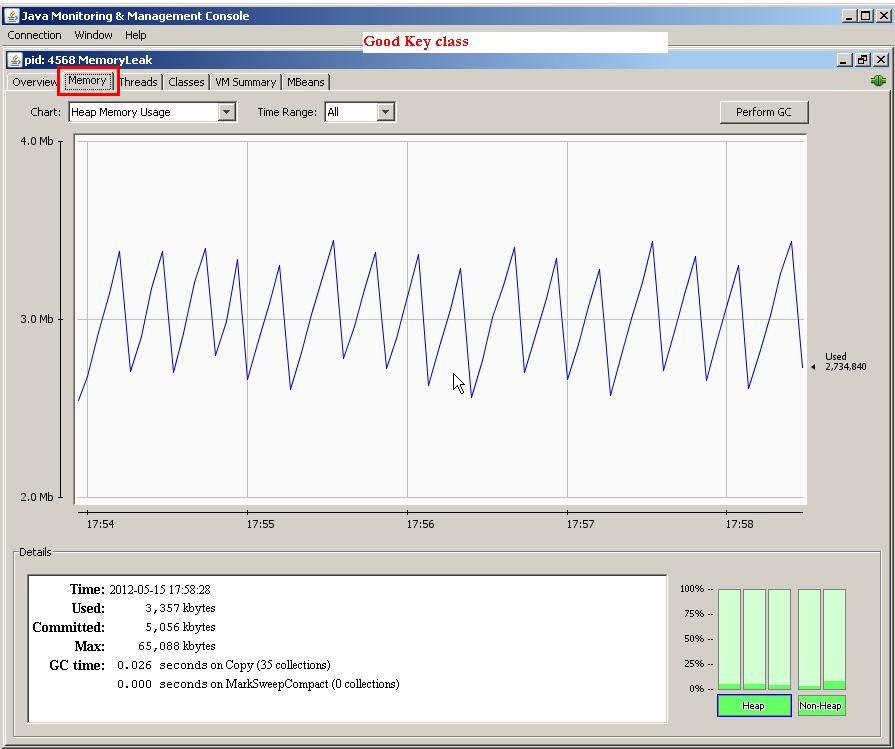
With Memory Leak (saw tooth graph):

You can learn more about profiling